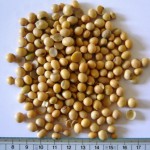
Comparison of Indonesian Soybeans with other 4 countries
M&K was requested by Indonesian Research Institute (LIPI) to know the nutritional value of Indonesian-grown soybeans, in comparison with the others.
Basic nutrition of the soybeans was analyzed at SRL in Japan by request of M&K Laboratories Inc. and compared with those grown in Japan, US, China and Brazil .
The characteristic of Indonesian soybeans is smaller in size, around 5 mm in length.

The results are shown as in the table.
|
|
Japan |
America |
China |
Brazil |
Indonesia |
|
Energy kcal |
417 |
433 |
422 |
451 |
420 |
|
Moisture % |
12.5 |
11.7 |
12.5 |
8.3 |
12.5 |
|
Protein g |
35.3 |
33.0 |
32.8 |
33.6 |
32.5 |
|
Lipid g |
19.0 |
21.7 |
19.5 |
22.6 |
17.6 |
|
Carbohydrate g |
28.2 |
28.8 |
30.8 |
30.7 |
32.8 |
|
Ash g |
5.0 |
4.8 |
4.4 |
4.8 |
4.6 |
|
Sodium mg |
1 |
1 |
1 |
2 |
0 |
(Unit: per 100g)
In general, Indonesia soybeans are lower in protein and lipid in comparison with Japanese beans and all other countries’ soybeans, respectively.
And Indonesian soybeans are higher in carbohydrate compared with those of other four countries.
Indonesian soybeans are almost comparative with Chinese ones in parameters compared.
Japan-grown soy beans are most nutritious in protein and lipid contents, as Brazil-harvested soybeans are over dried.
It is said that Japanese soybean industry has concluded Indonesian soybeans are low quality in producing Tofu, Natto or other products.
Indonesian soybeans may not be introduced to Japan from the reason above mentioned.
We do not know what nutritional soybeans are most adequate for soybean produces.
It is needed to be clarified this point by the expert of soy bean industry.
On the contrary, we think that LIPI or any other government agencies or research institution can provide nutritional values of Indonesian soybeans.
By showing additional data, they shall counteract the present results and emphasize the advantages of local soybeans.
We welcome the opinions to this presentation.
Additional Information
After uploading, new information was provided by Japanese soybean importer.
The information includes analyses of multiple batches of soybeans from US and additional data of soybean from Canada, as shown in the following table.
|
|
Japan |
America |
Canada(n=1) |
Indonesia |
|
Moisture % |
12.5 |
10.5~12.2 |
10.9 |
12.5 |
|
Protein g |
35.3 |
36.4~39.7 |
35.9 |
32.5 |
|
Lipid g |
19.0 |
17.1~19.1 |
20.9 |
17.6 |
|
Carbohydrate g |
28.2 |
20.2~21.4 |
23.6 |
32.8 |
|
Fiber g |
— |
5.0~5.5 |
— |
— |
|
Total of Prorein+Lipid g |
54.3 |
55.2~56.8 |
56.8 |
50.1 |
(unit per 100g)
Merckmal of highly traded soybeans may be placed on total sum of protein plus lipid.
We guess soybeans can be considered high quality if the total sum is around or above 55.
Indonesian soybeans have a lower content in protein.
American soybeans subjected to analyses are Non-GMO grains.